A configurator for play & conversion
My Role
Project Lead, Experience & Strategy
Team
Gloria Lee . Product Manager
Jennifer Hui . Freelance UX Researcher
Allan Buntoengsuk . Freelance Visual Designer (Bundling)
Epigraph . Engineering
Metrics . Tim Jorgensen
Dev . Epigraph, Wilfredo Bunge & Leo Muzi
Stakeholders
CX, Operations, Product
Problem
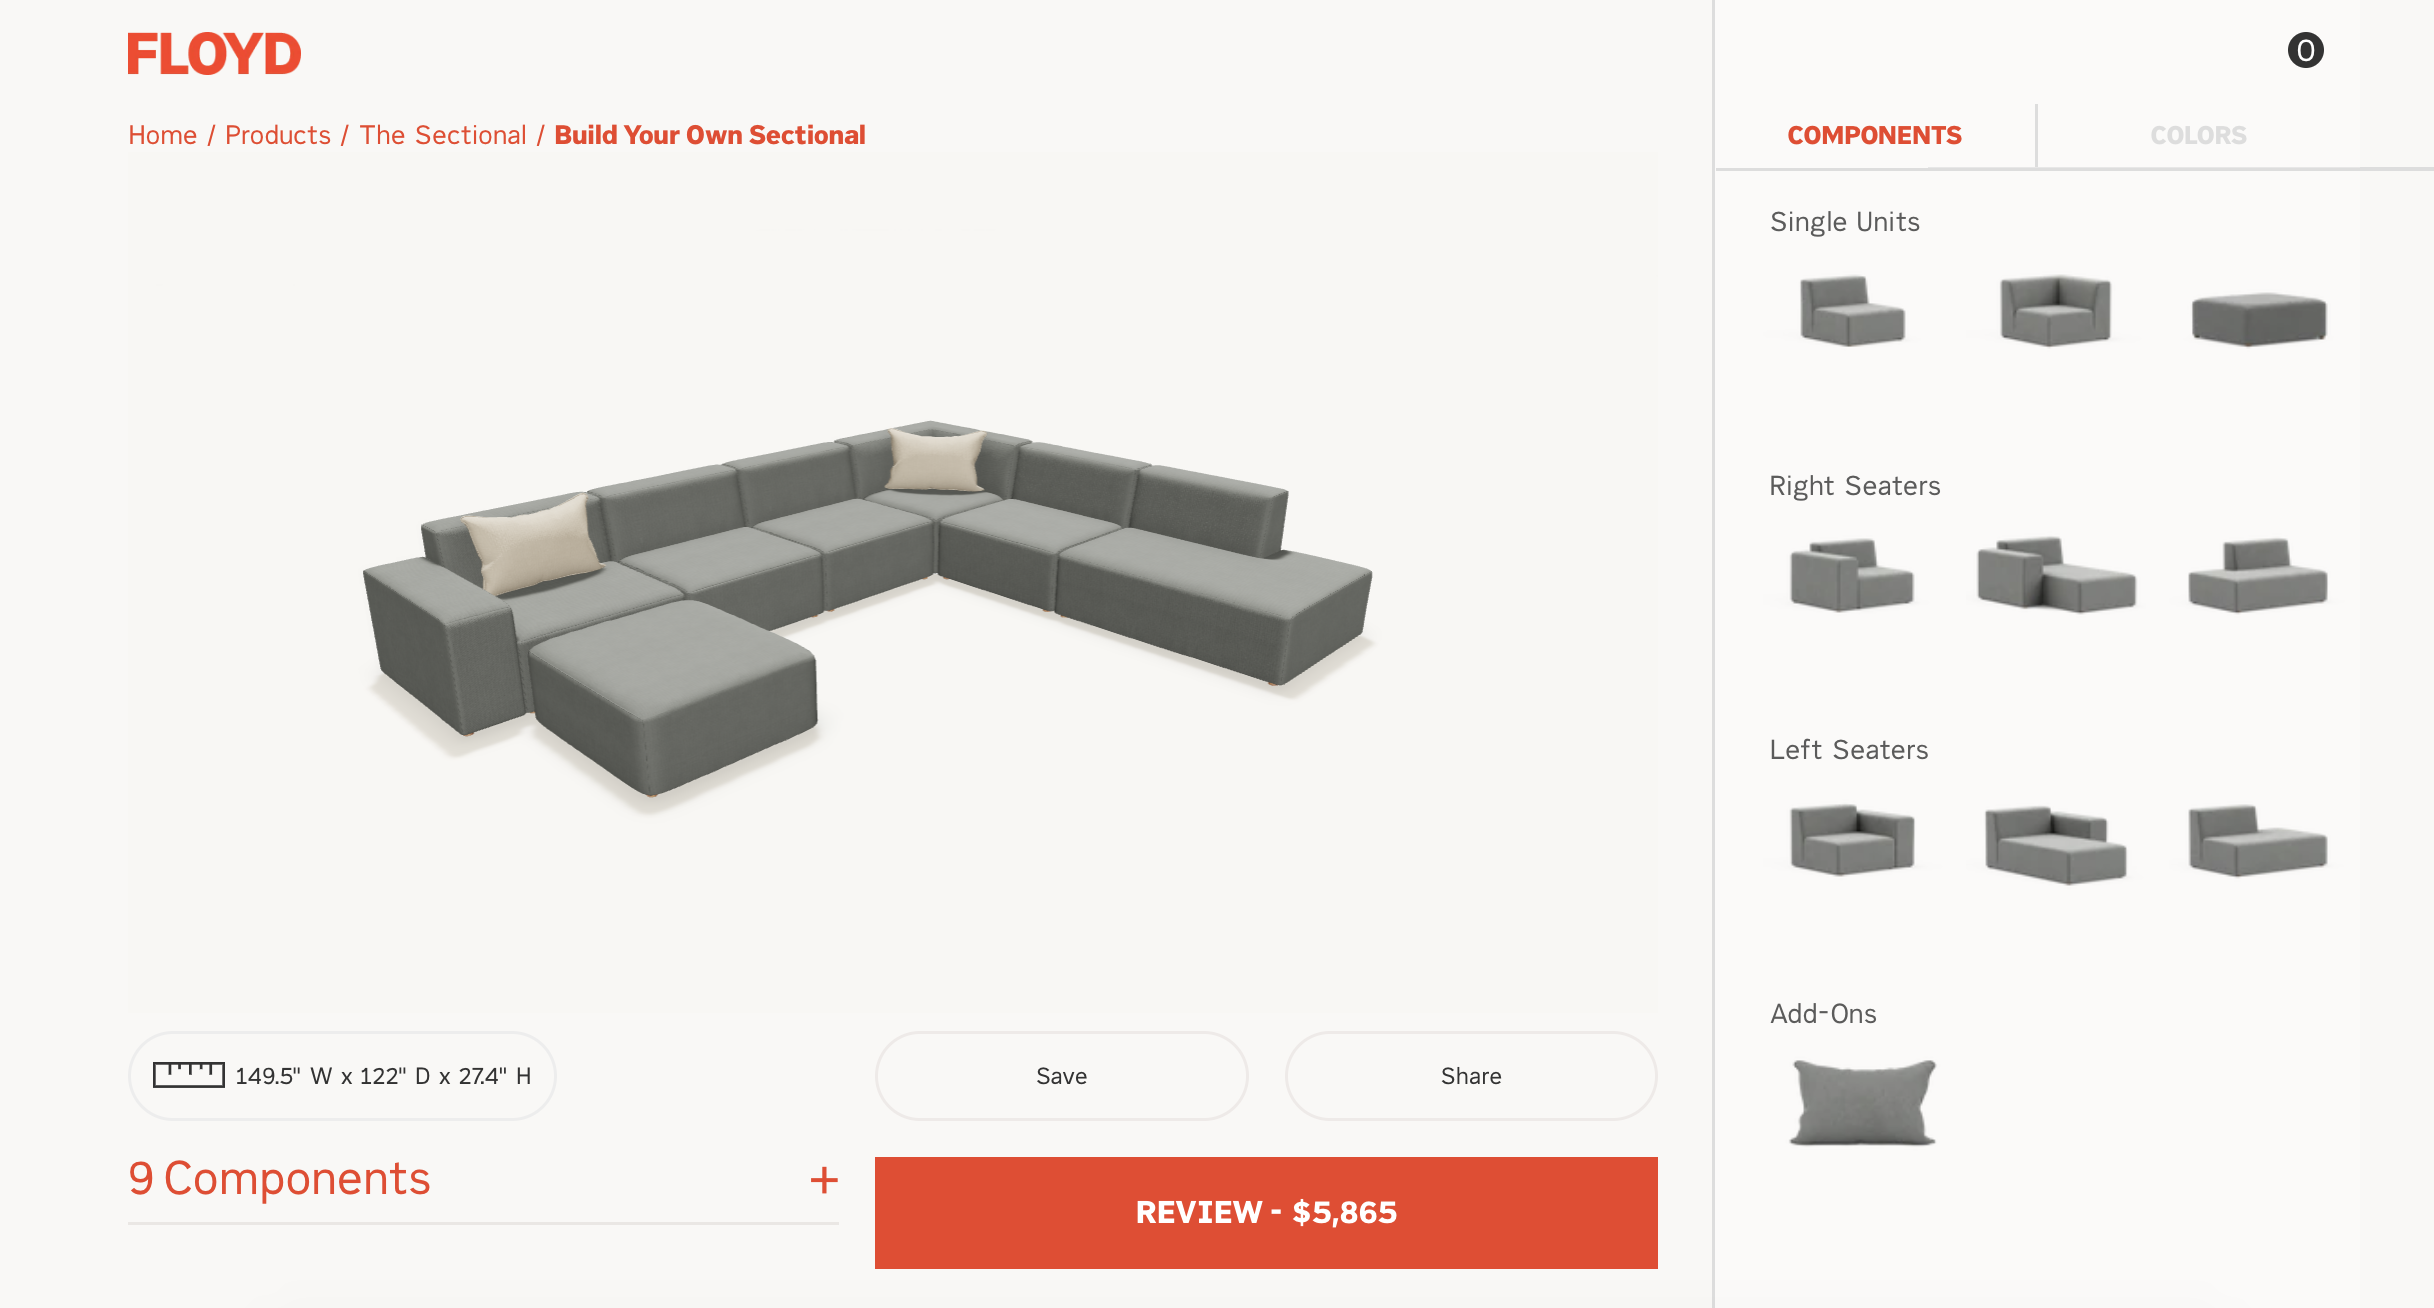
How might we provide users with an elevated, branded experience for buying a custom sectional? An alternative to our pre-configured options, adding clarity and confidence to the overall Sectional discovery & purchase journey.
Outcome
2x Revenue-Per-User, 63% increase in CVR compared to the Sectional PDP, and a consistently lower bounce-rate than the Sectional PDP, despite a longer load-time. We launched a configurator tool that does double-duty across devices to encourage play on mobile, and educate and convert at a significantly higher rate across all devices. This is attributed to the unique strategy employed during user testing and validation.
Coming off the heels of launching the modular sectional, we noticed there was a shift in customer behavior with this experience - they were visiting way more pages during their time on our website and were asking a lot more questions about how the sectional worked to our CX team.
Preliminary Research
-
This early research informed the overall user research plan, but since our core demographic has an above-average rate of early adoption for new tech, we knew we could push the experience beyond industry standard best practices. We had a unique position and opportunity to innovate.
-
Benchmarking, Competitive Landscape across entire discovery/buying journey of modular furniture
Best Practices
Frame up the Problem Statement
Moderated discovery interviews
-
We reviewed the core themes, cardsorted and then prioritized impact for each area of the user journey.
User-Centric Approach
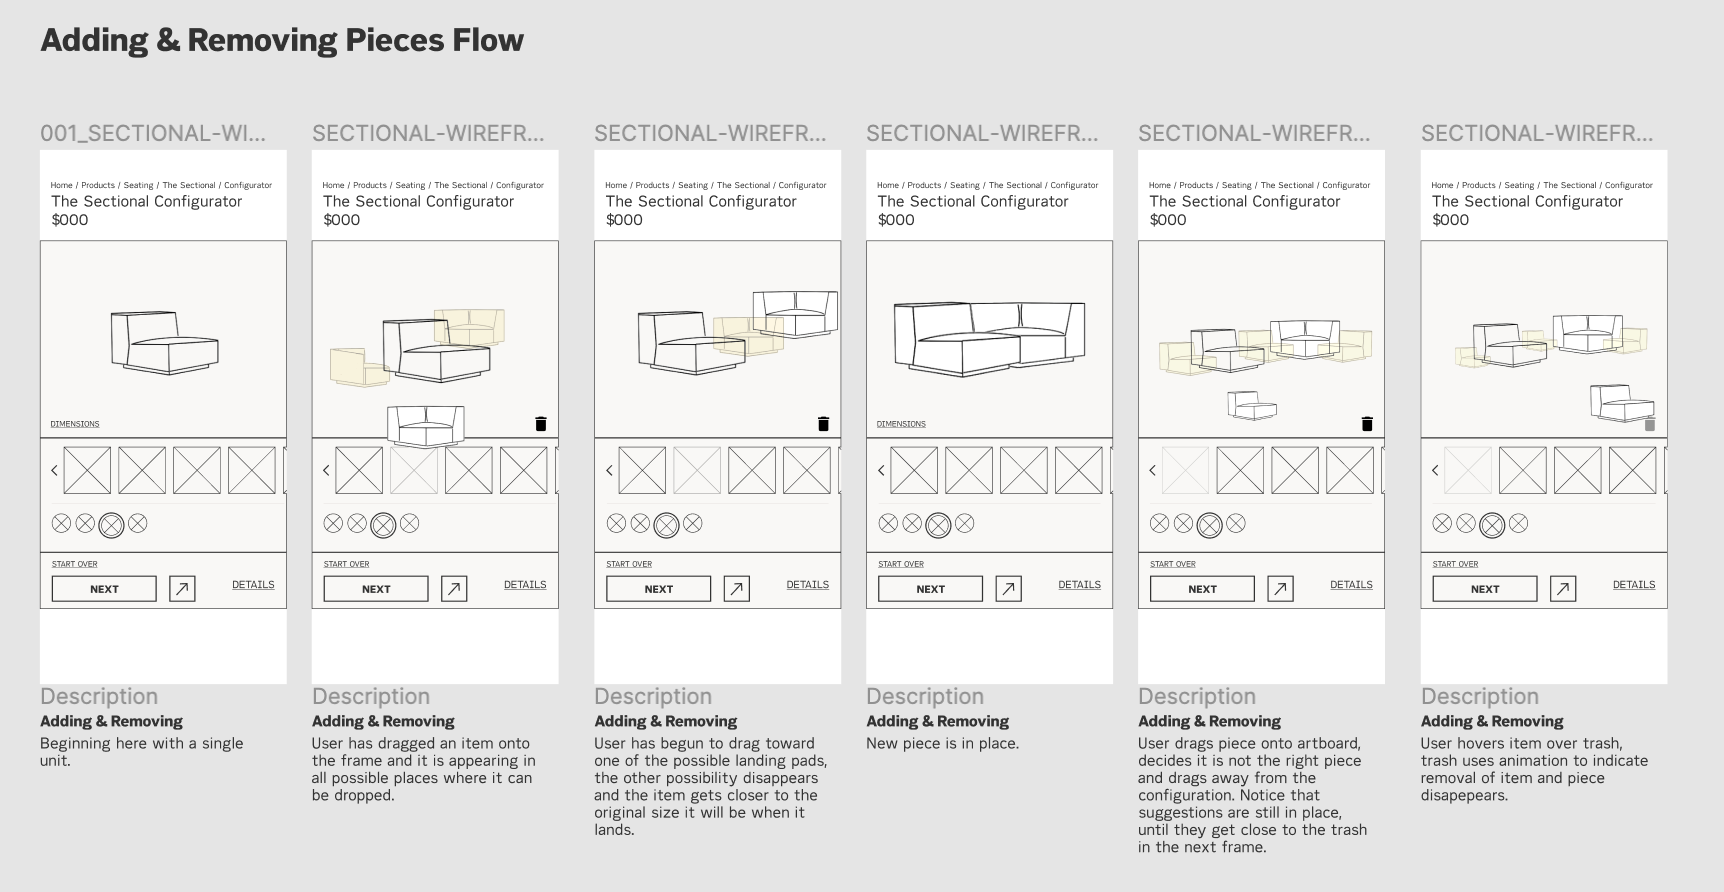
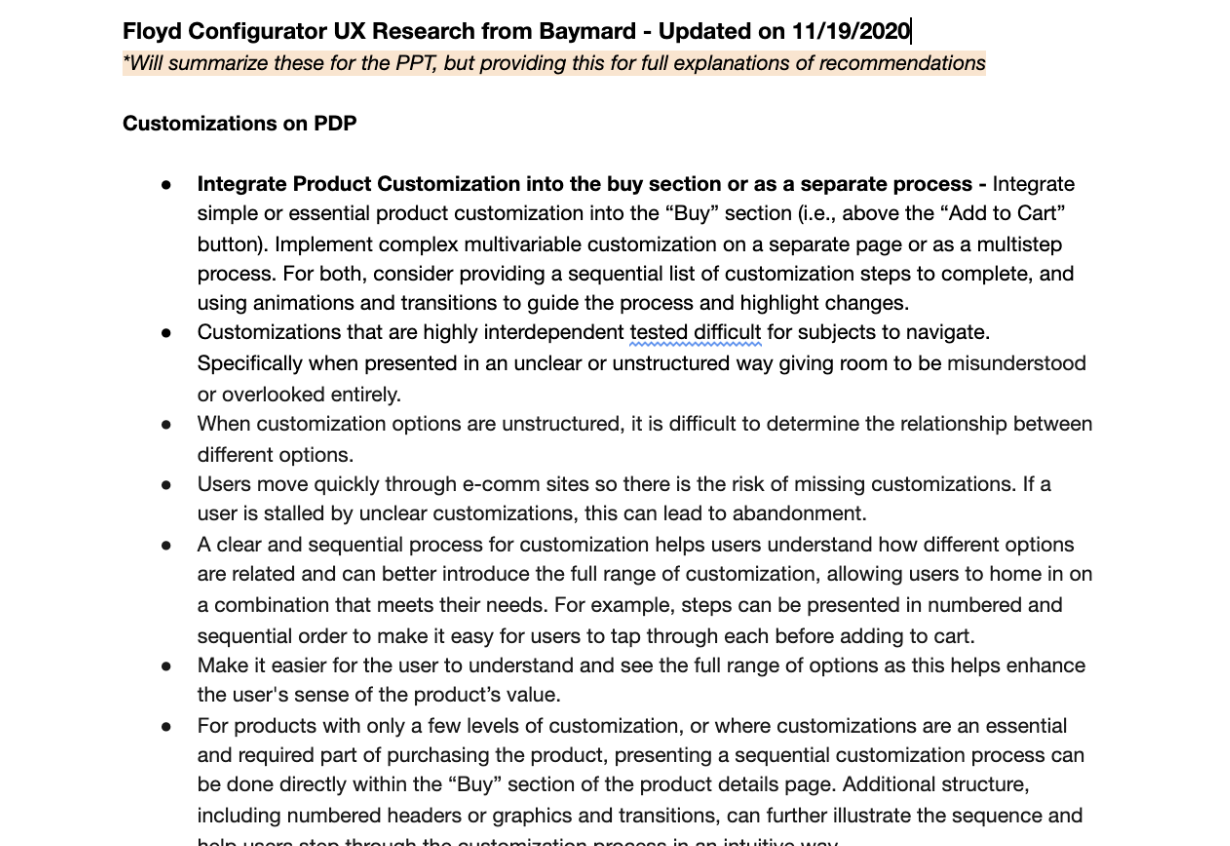
We tested different usability preferences through user interviews and heuristic evaluations of other configurators in the industry. Ultimately, we landed here, with a simple drag & drop flow. The devil was in the details as we honed in on the specific interactions with our development partner, Epigraph.
-
Teaching tools (like gifs, overlays, etc) helped users (8/10) to understand how products work. This will be useful for the group of users who enter via ad or direct-to-configuration.
-
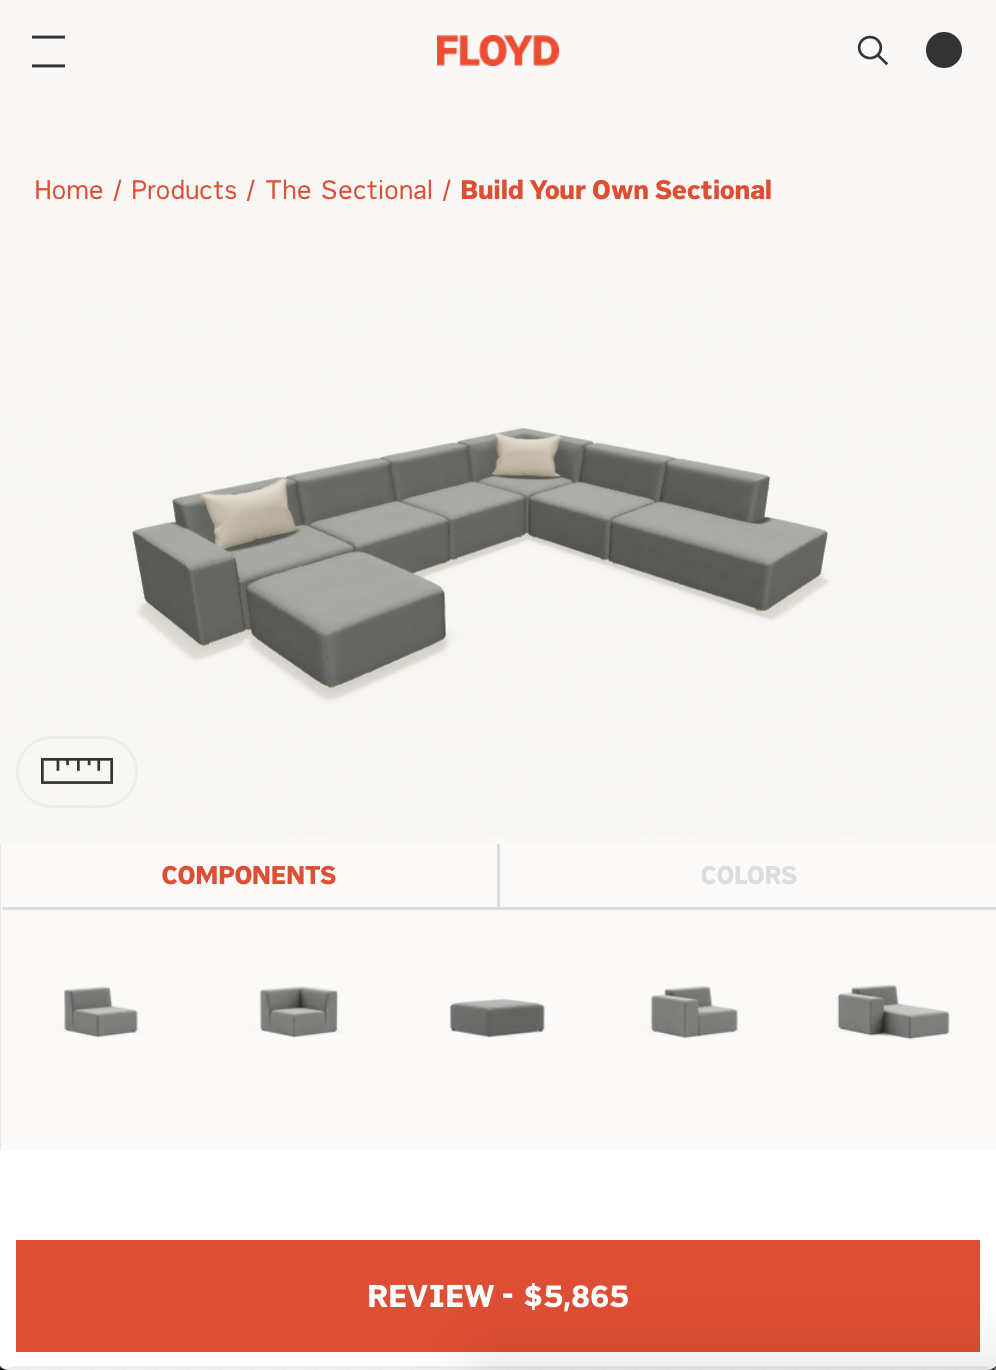
Cross-Device: 8/10 play on Mobile but make actual custom purchase on Desktop
-
Most users anticipated being able to edit a preconfigured option they clicked into
Users generally have an idea of what they want, so they filter by dimensions and shape on the Category Page
Steep learning curve on configurators for all users (drag/drop/snap/rotate main reasons)
-
Users may not click next if not ready to buy, would save for complex configurations, but return to rebuild for easy ones
Personas, Painpoints & The User Journey


While I built out several journeys, this one served as our base. You’ll see highs and lows, actions taken and then broken out Key Features we would need to consider. We used this list to inform the kickoff and scoping with our development partners.
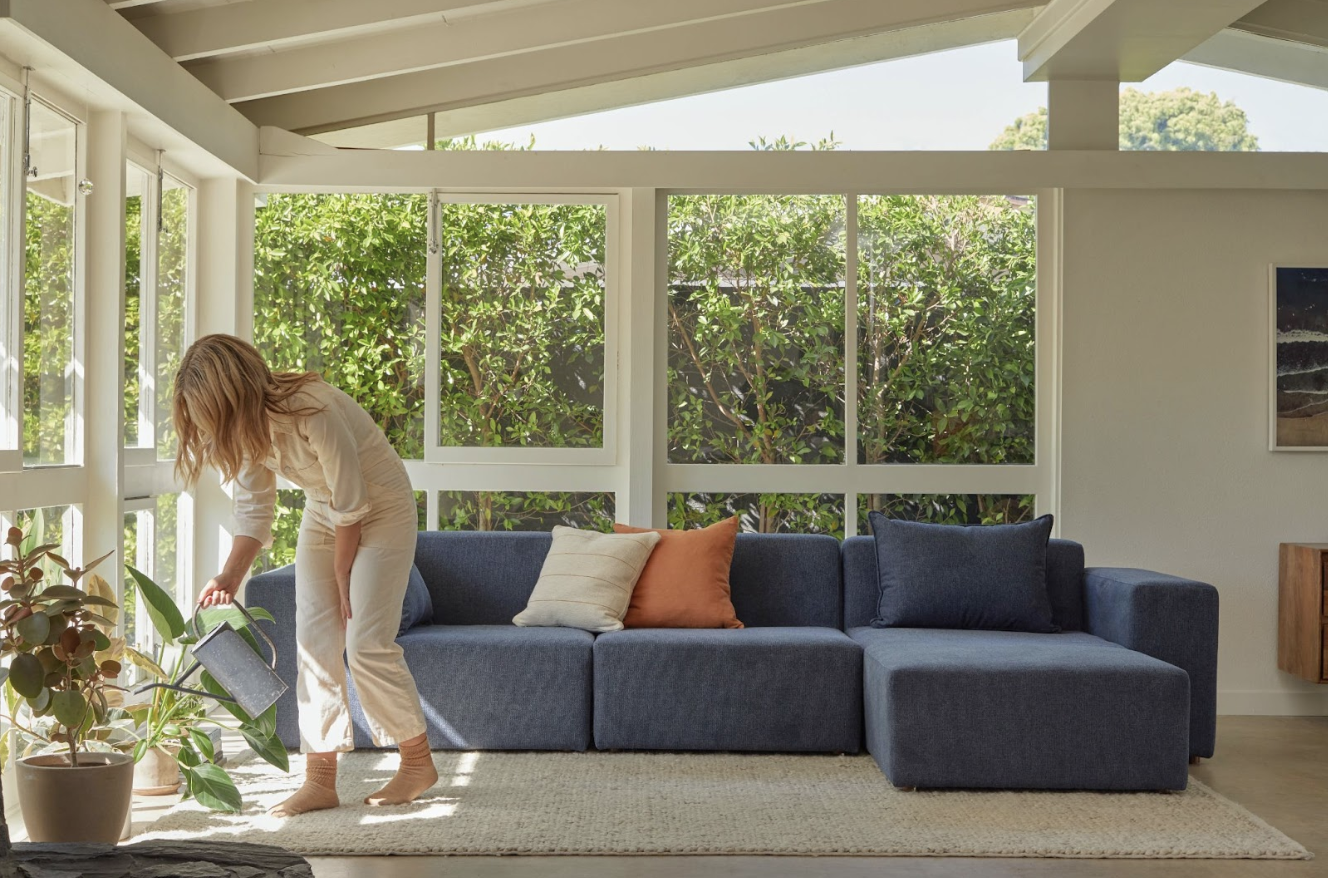
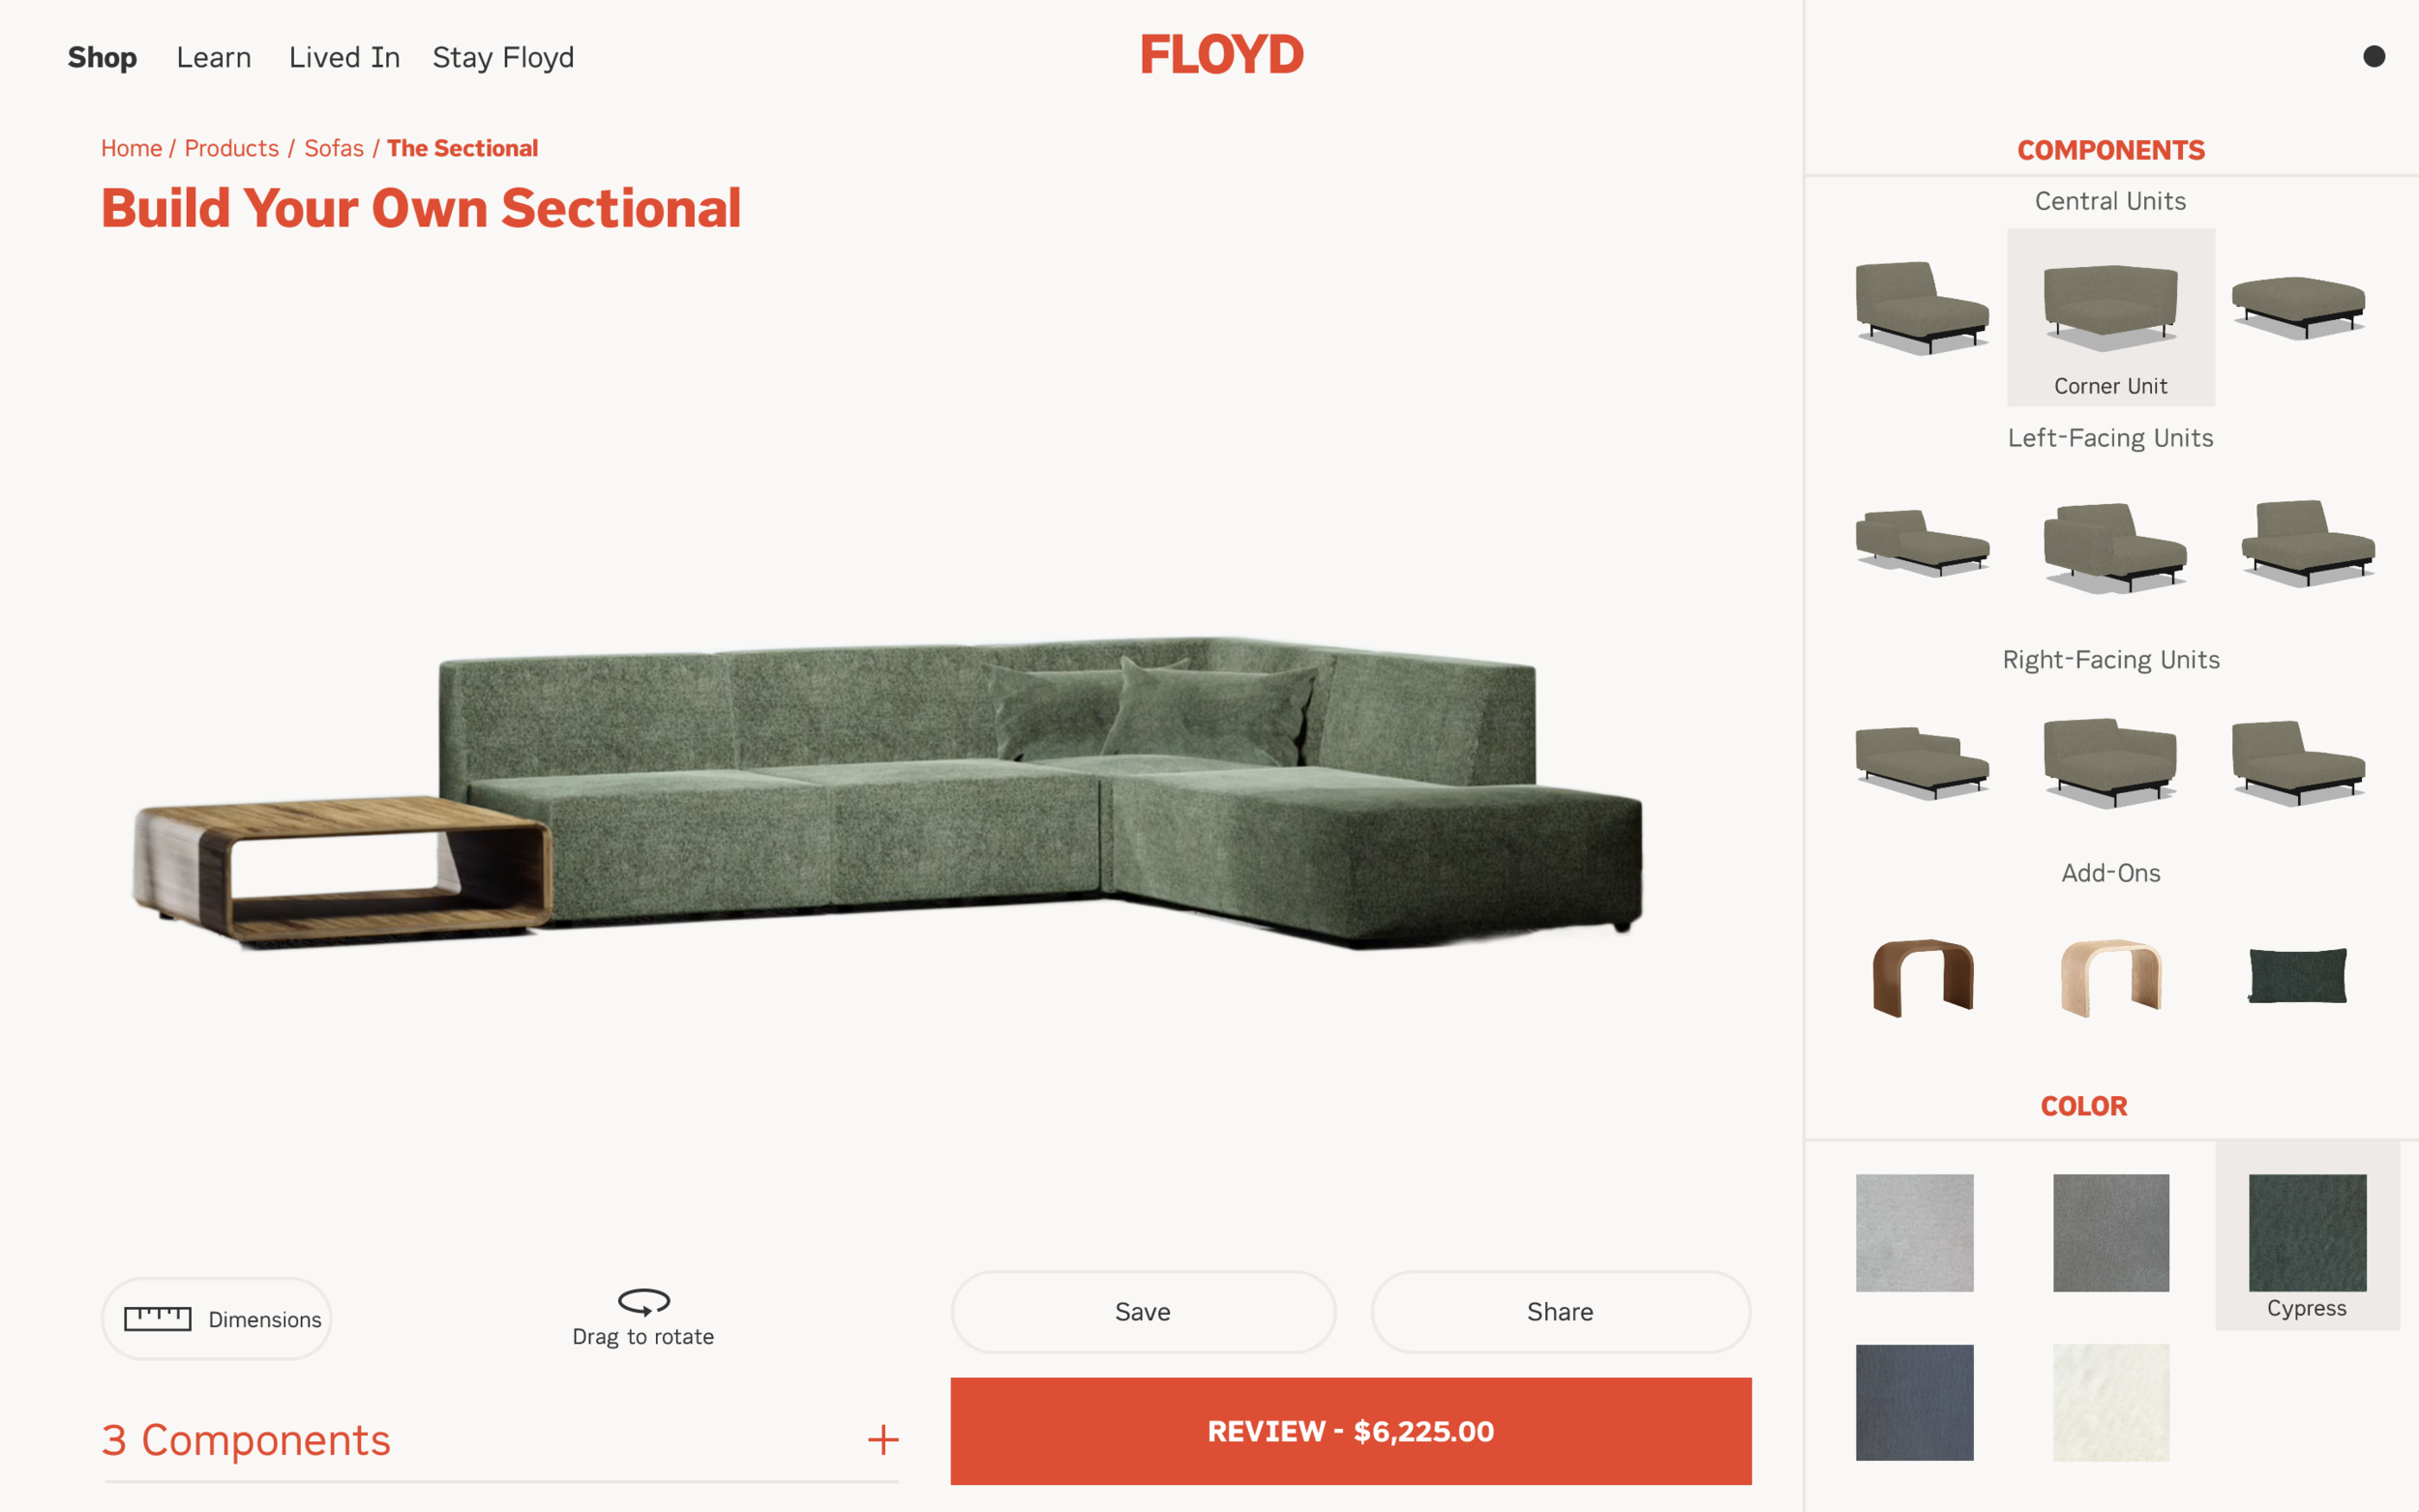
Branded Experience
We previously explored the idea of a configurator for another complex product, but rudimentary rendering technology and back-end technology prevented us from it. When approaching the problem with new tech & fresh eyes, we knew we needed a trusted, branded, fully-functional, Floyd tool that supported an intuitive shopping experience across devices.
Metrics & Takeaways
Enhancements increased conversion, reduced bounce rate and improved confidence on mobilebased on user research, testing, and validation.
-
Revenue-per-user is 2x that of the Sectional PDP, proving it is far more profitable to send users to the configurator experience vs. the standard PDP
-
63% increase in CVR (2.16% overall, 3.24% on Desktop, 1.47% on mobile) vs. Sectional PDP experience
-
Time-on-page 02:28 (6% less than Sectional PDP)
Overall lower bounce rate compared to Sectional PDP
-
Users who interacted with this tool accounted for 25% of overall revenue for The Sectional.
Item description
More
Visit the current Sectional experience live on Floydhome.com.